How site monitoring works
NexaWP Manager provides comprehensive real-time monitoring for your WordPress sites, ensuring you never miss critical issues that could affect your website’s availability or performance.
Once activated, our monitoring system performs automated health checks at configurable intervals (every 1, 5, 15, 30, or 60 minutes) to assess your site’s overall status. Each health check evaluates multiple key metrics including server response time, SSL certificate validity, memory usage, and general accessibility.
The collected data is then aggregated into an intuitive health score ranging from 0 to 100, giving you an instant overview of your site’s condition. All monitoring data is retained according to your preferences, with options ranging from 7 days up to a full year, allowing you to analyze trends and identify recurring issues over time.
Activating and configuring monitoring
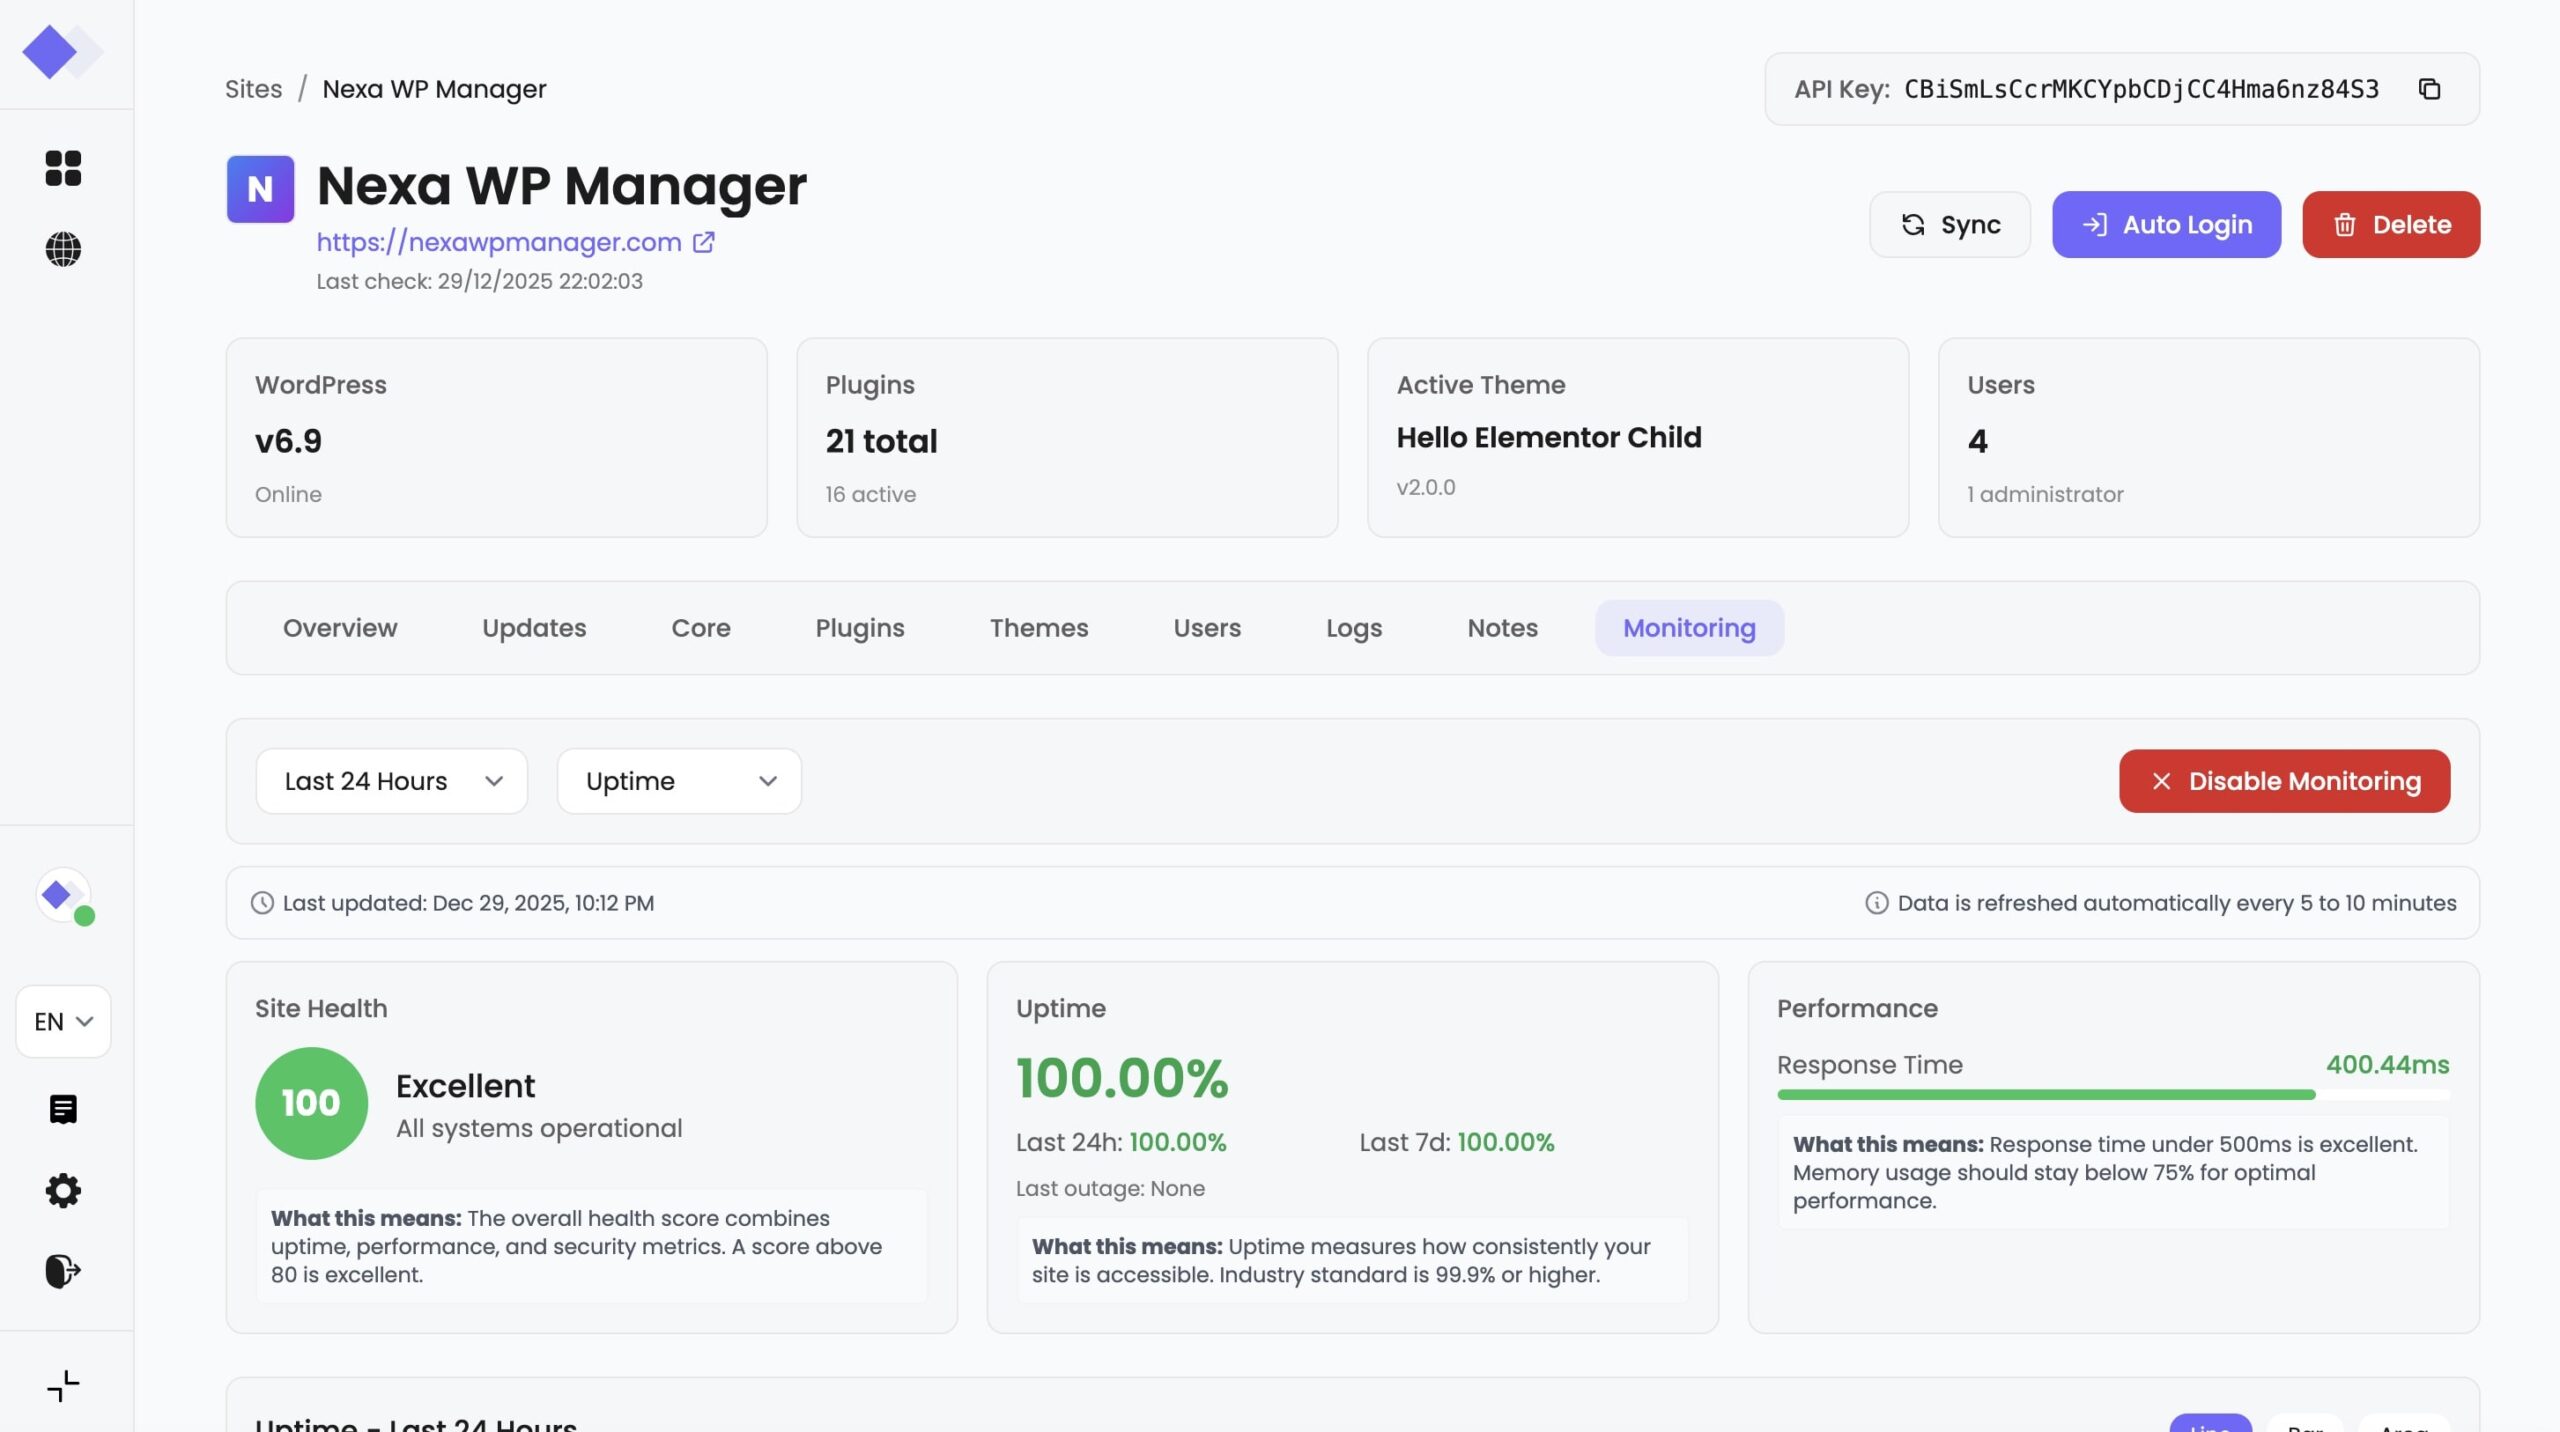
Getting started with monitoring is straightforward. Navigate to any site in your NexaWP Manager dashboard and access the Monitoring tab. If monitoring is not yet active, you’ll see an activation panel with a simple “Enable Monitoring” button.
Upon activation, the system immediately performs an initial health check to establish baseline metrics for your site. You can customize monitoring behavior through the settings panel, where you can adjust the check interval based on how critical your site is, set performance thresholds (response time alerts trigger at 1000ms by default, memory usage at 80%), and configure your data retention period.
The monitoring dashboard displays real-time charts for uptime, response time, and resource usage, with selectable time ranges (24 hours, 7 days, 30 days, or 90 days) to help you visualize your site’s performance patterns.
Understanding health scores and metrics
The health score is calculated based on multiple factors that directly impact your site’s user experience. A score of 90-100 indicates excellent health with optimal performance, while scores below 25 signal critical issues requiring immediate attention.
The scoring algorithm considers several weighted factors: site accessibility (a site that’s down immediately scores 0), response time (penalties apply for responses exceeding 500ms, with significant deductions above 2000ms), memory usage (scores decrease when usage exceeds 80%), and SSL certificate status (invalid certificates result in a 20-point deduction).
The uptime percentage tracks your site’s availability over different periods, showing both 24-hour and 7-day averages along with the timestamp of the last detected outage.
Performance metrics display average, minimum, and maximum response times, helping you identify both typical behavior and performance spikes.
Automatic notifications and alerts
NexaWP Manager’s alert system ensures you’re immediately informed when issues arise. When the monitoring system detects a critical problem—such as your site becoming unreachable, an SSL certificate expiring, or response times exceeding configured thresholds—it automatically creates an alert and can notify you via email.
Critical alerts trigger immediate email notifications containing detailed information about the issue, including the exact time of detection, error messages, and recommended actions specific to the alert type.
When an issue is resolved, you’ll receive a recovery notification confirming that your site is back to normal, along with an incident summary showing the total downtime duration and current performance metrics. The alert history in your dashboard provides complete visibility into past incidents, showing alert severity (critical, warning, or info), resolution status, and notification delivery status for both the initial alert and recovery emails.
This comprehensive notification system operates around the clock, ensuring you can respond quickly to protect your site’s availability and your visitors’ experience.
General questions
Site monitoring is a feature that automatically checks your WordPress site’s availability and performance at regular intervals. It tracks uptime, response time, SSL certificate status, and memory usage, alerting you immediately when issues are detected.
Navigate to your site’s dashboard in NexaWP Manager, click on the “Monitoring” tab, and press the “Enable Monitoring” button. The system will immediately perform an initial health check and begin regular monitoring based on your configured interval.
In the Monitoring tab, click the “Disable Monitoring” button. A confirmation dialog will appear warning you that you’ll stop receiving alerts and no new data will be collected. Your historical data will be preserved according to your retention settings.
Yes! NexaWP Manager offers a single all-inclusive plan. Site monitoring is included for all subscribers with no additional fees or feature restrictions. You get full access to all monitoring capabilities including customizable intervals, alerts, notifications, and data retention options.
Health checks & intervals
You can configure the check interval to 1, 5, 15, 30, or 60 minutes depending on your needs. More frequent checks provide faster issue detection but may generate more data.
Each health check evaluates: site accessibility (is the site responding?), response time (how fast the server responds), SSL certificate validity, and memory usage. These metrics are combined into an overall health score.
The health score is a value from 0 to 100 representing your site’s overall condition. It starts at 100 and deductions are made for issues: site down = 0, response time > 2000ms = -30 points, response time > 1000ms = -15 points, response time > 500ms = -5 points, memory usage > 80% = -10 points, invalid SSL = -20 points.
- Excellent (90-100): Your site is performing optimally
- Good (75-89): Site is healthy with minor performance considerations
- Fair (50-74): Some issues need attention
- Poor (25-49): Significant problems affecting performance
- Critical (0-24): Immediate action required
Alerts & notifications
NexaWP Manager generates alerts for: site downtime (site_down), SSL certificate issues (ssl_expired), slow response times (response_time), high memory usage (memory_usage), and high CPU usage (cpu_usage).
- Critical: Urgent issues requiring immediate attention (e.g., site is down)
- Warning: Potential problems that should be addressed soon
- Info: Informational notices about your site’s status
You’ll receive a notification within your configured monitoring interval. For example, with a 5-minute interval, downtime will be detected and reported within 5-10 minutes of occurrence.
Yes, when an issue is resolved, you’ll receive a recovery email containing: confirmation that the site is back online, incident details (duration, error message), current performance metrics, and recommended follow-up actions.
Check that email notifications are enabled in your monitoring settings. Also verify your email address is correct in your profile and check your spam folder. Rate limiting may also apply to prevent notification flooding.
Data & charts
You can view data for the last 24 hours, 7 days, 30 days, or 90 days. Select your preferred range from the dropdown menu in the monitoring dashboard.
Data retention is configurable: 7, 30, 60, 90, 180, or 365 days. After this period, older data is automatically deleted.
You can visualize your data using line charts, bar charts, or area charts. Switch between them using the view toggle buttons above the chart.
The available metrics are: Uptime (percentage over time), Response Time (in milliseconds), Memory Usage (percentage), and CPU Usage (percentage where available).
Thresholds & configuration
- Response Time: 1000ms (alerts triggered above this value)
- Memory Usage: 80% (alerts triggered above this value)
- CPU Usage: 70% (alerts triggered above this value)
Yes, you can adjust thresholds in the monitoring settings. Response time can be set between 100ms and 10000ms, while memory and CPU thresholds can be set between 50% and 100%.
When a metric exceeds its configured threshold, an alert is created with the appropriate severity level. If email notifications are enabled, you’ll receive an immediate notification with details and recommended actions.
Troubleshooting
This can happen if: your server is blocking our monitoring requests, there’s a firewall rule preventing access, your site is experiencing intermittent connectivity issues, or there’s a DNS propagation delay. Check your server logs and firewall settings.
High response times can be caused by: slow server hardware, unoptimized WordPress plugins, database performance issues, lack of caching, or high traffic. Consider implementing caching and optimizing your plugins.
The health score is calculated based on the last health check data. If your site recovered from an issue, the score will update on the next scheduled check. You can also manually trigger a health check to refresh the data.
The monitoring dashboard auto-refreshes every 15 seconds when active. Data is also updated after each scheduled health check based on your interval setting.
Historical monitoring data and alerts are stored according to your retention settings. Currently, data can be viewed in the dashboard with various time range filters.